GUI
ampscan comes with a GUI supplied to access the core functionality of the package. A basic how-to guide is supplied below.
To launch the GUI, navigate to the gui folder within ampscan. This can be accessed from GitHub. Use the cmd prompt to launch the gui through python.
>>> python ampscanGUI.py
Basic Functionality
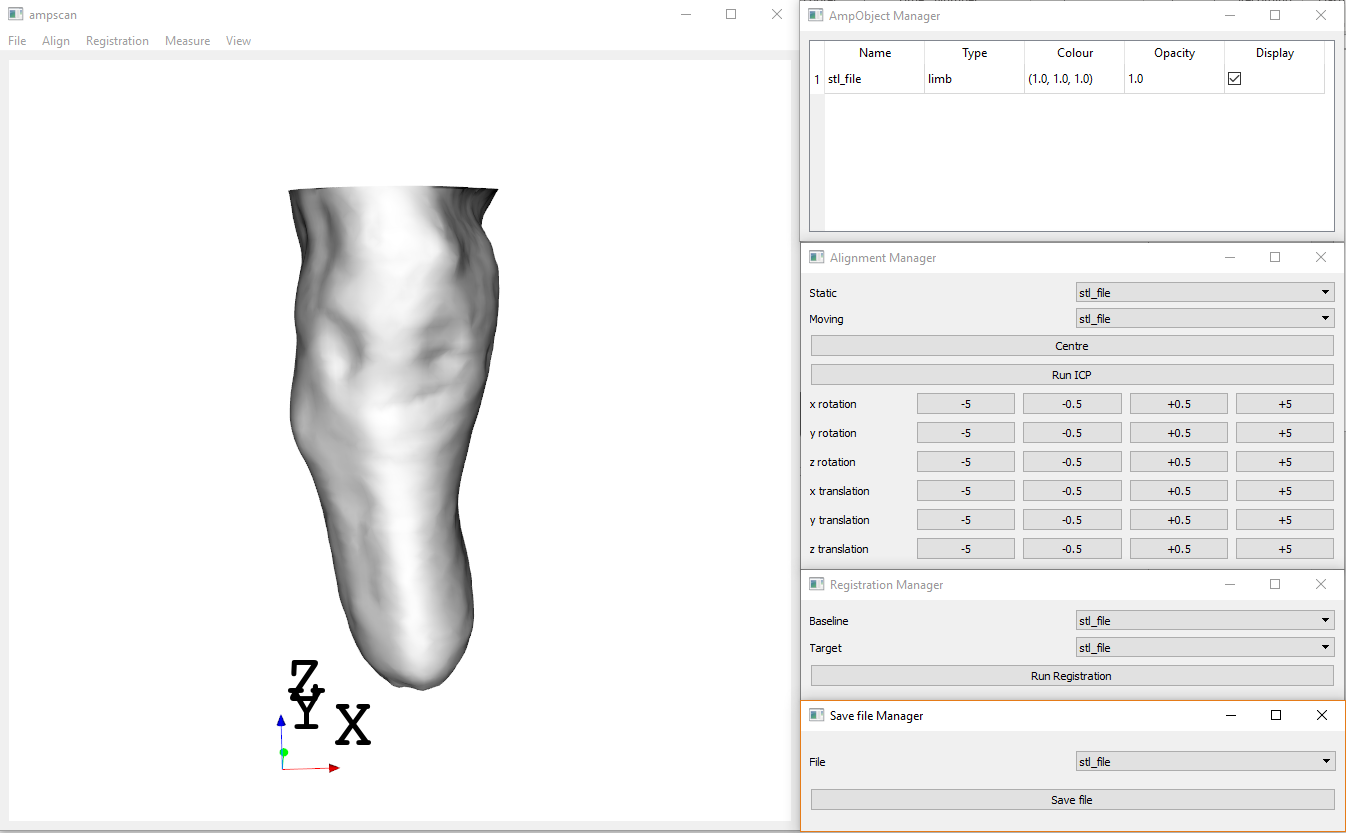
The ampscan GUI is based upon several seperate windows to control different components. The windows can be accessed using the toolbar in the main screen. For example, to open the Registration Manager, navigate to the ‘Registration’ drop-down in the toolbar.
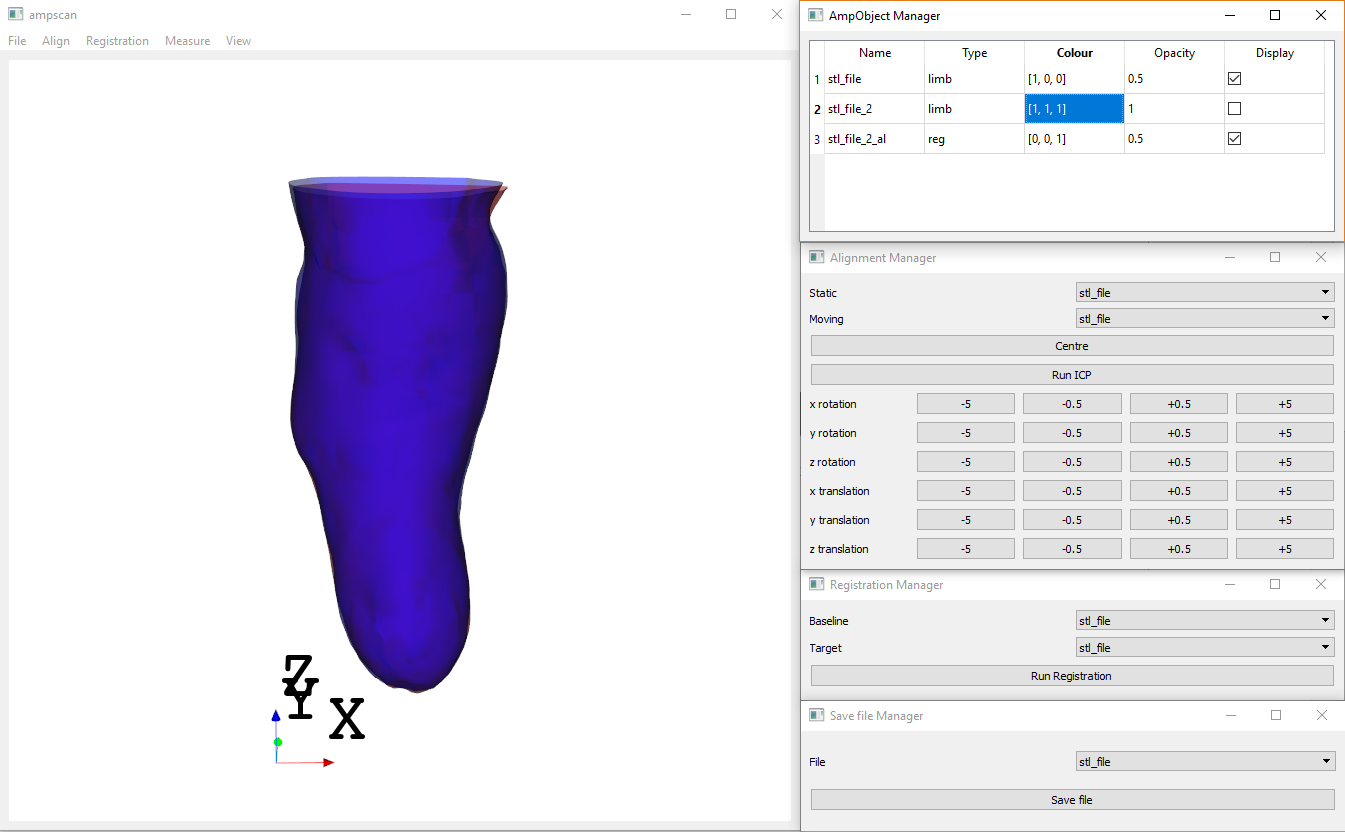
With all windows open, the GUI will look as follows:
Alignment
To commence alignment, open two files into the AmpObject Manager. Select which file you want to be ‘static’ and which one ‘moving’ using the drop-down menus in the alignment manager.
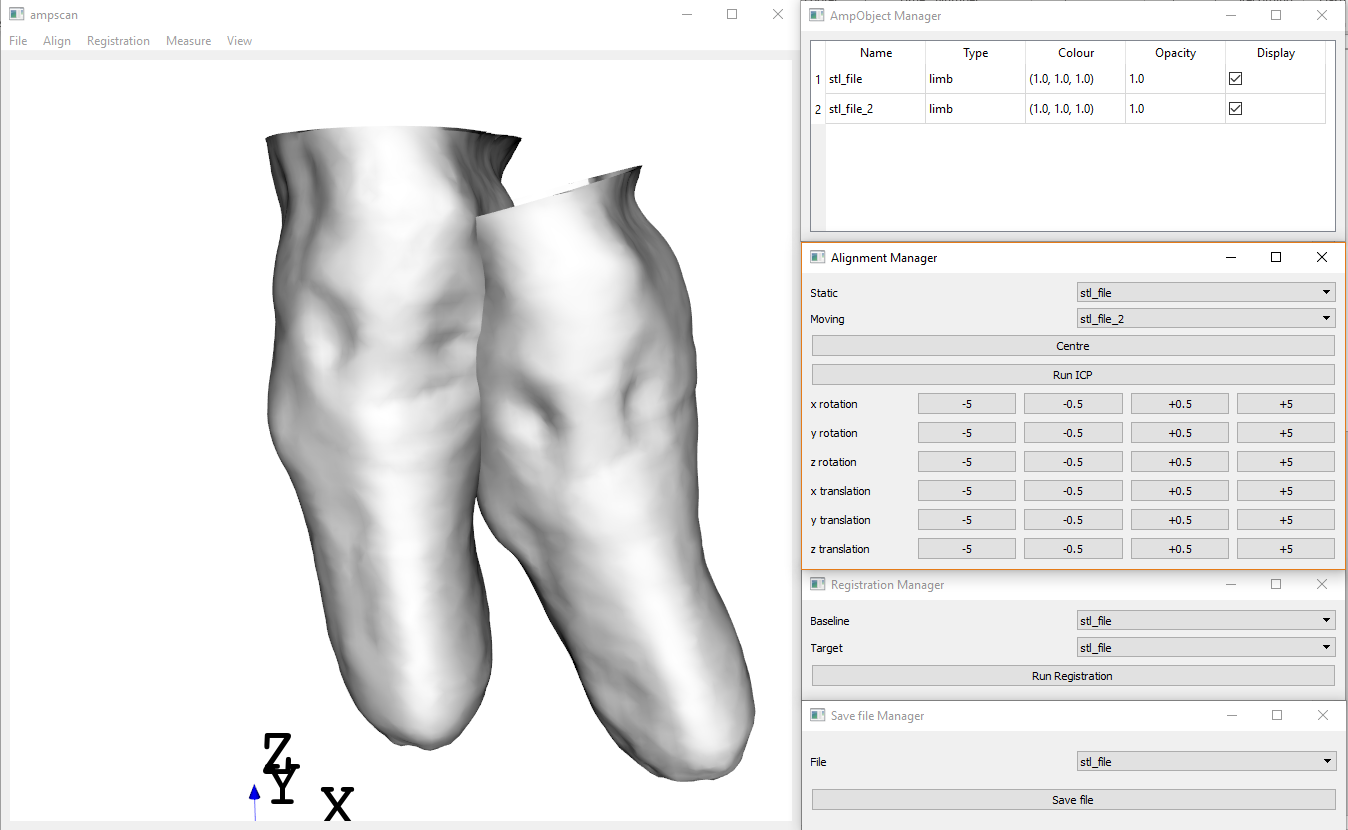
The initial step for alignment is often to centre the two shapes, which can be done with a single button press in the Alignment Manager. You can also perform manual alignment through the translation and rotation tools.
You can change the colour and opacity of the scans to make it easier when aligning using the AmpObject Manager.
To automatically align the two shapes, use the ICP tool in the Alignment Manager. Once you have run this function, a new AmpObject will be created. If you require any further adjustments from this point, then use the manual alignment tools.
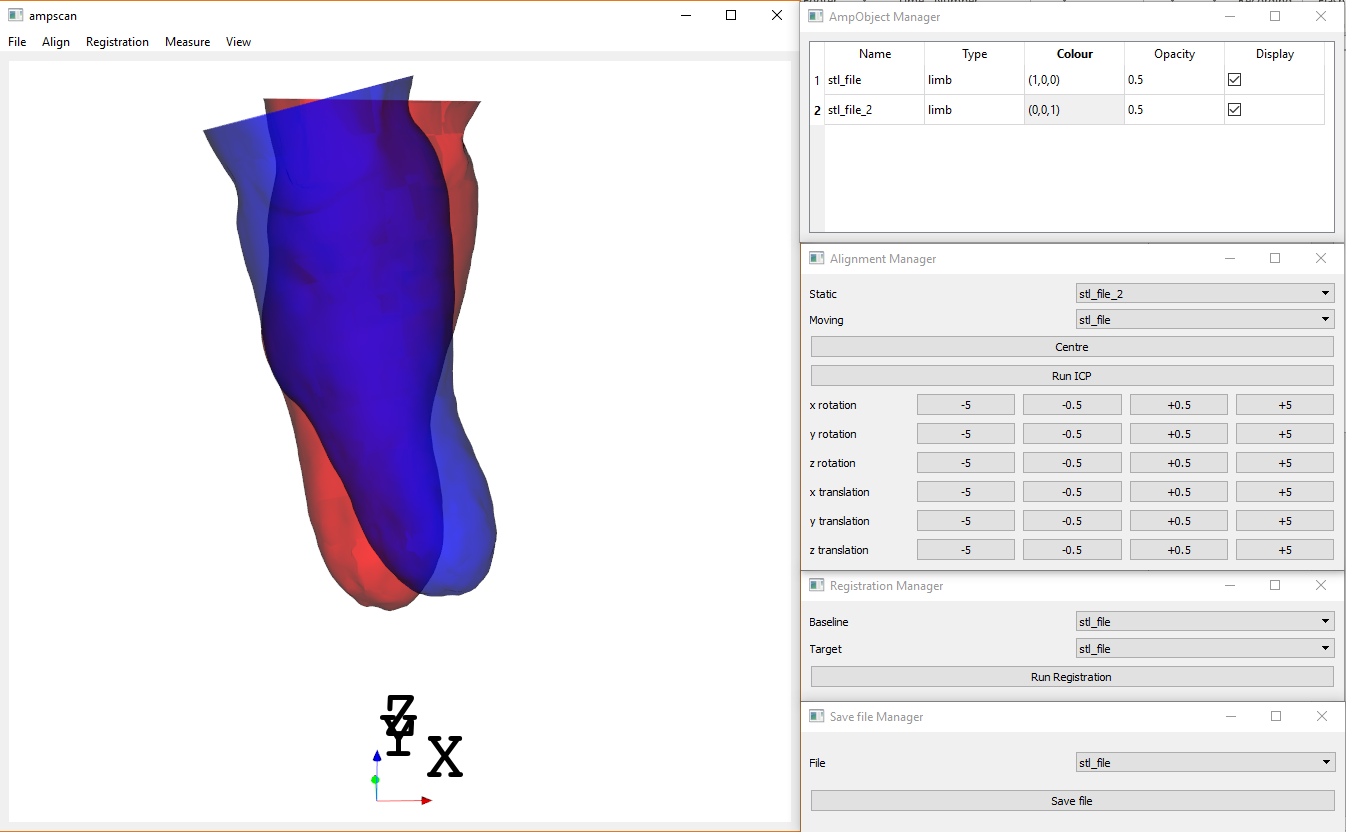
Registration
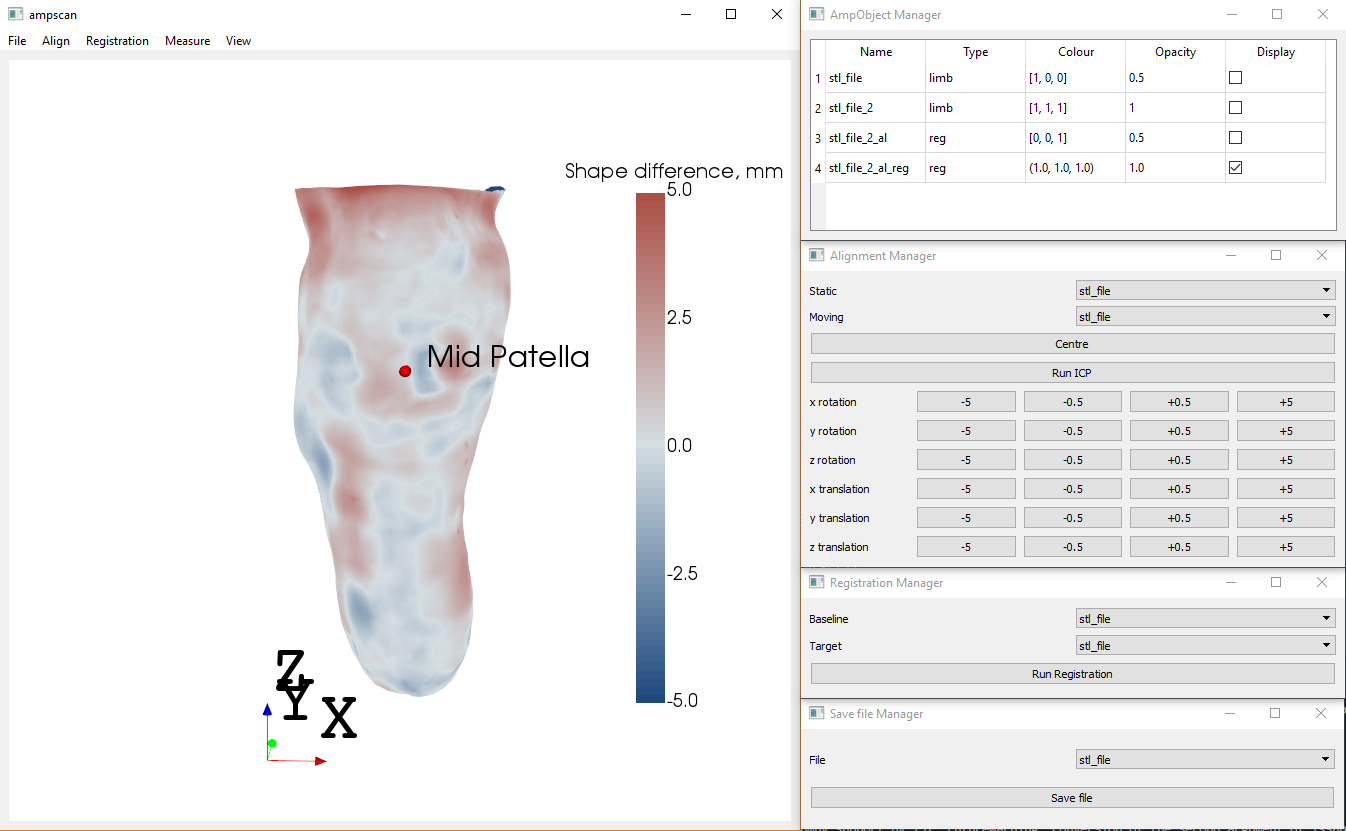
Once the two scans have been aligned, the registration function can be performed quantify the shape difference between the two objects.
Under the registration manager, select the Baseline and Target AmpObject. The vertices on the Baseline Object and morphed onto the Target. As such, the Target mesh will end up with the same number of vertices as the Baseline mesh.
Once this has been completed, direct point-to-point comparison between the objects is performed to visualise the difference between the shapes with a contour map

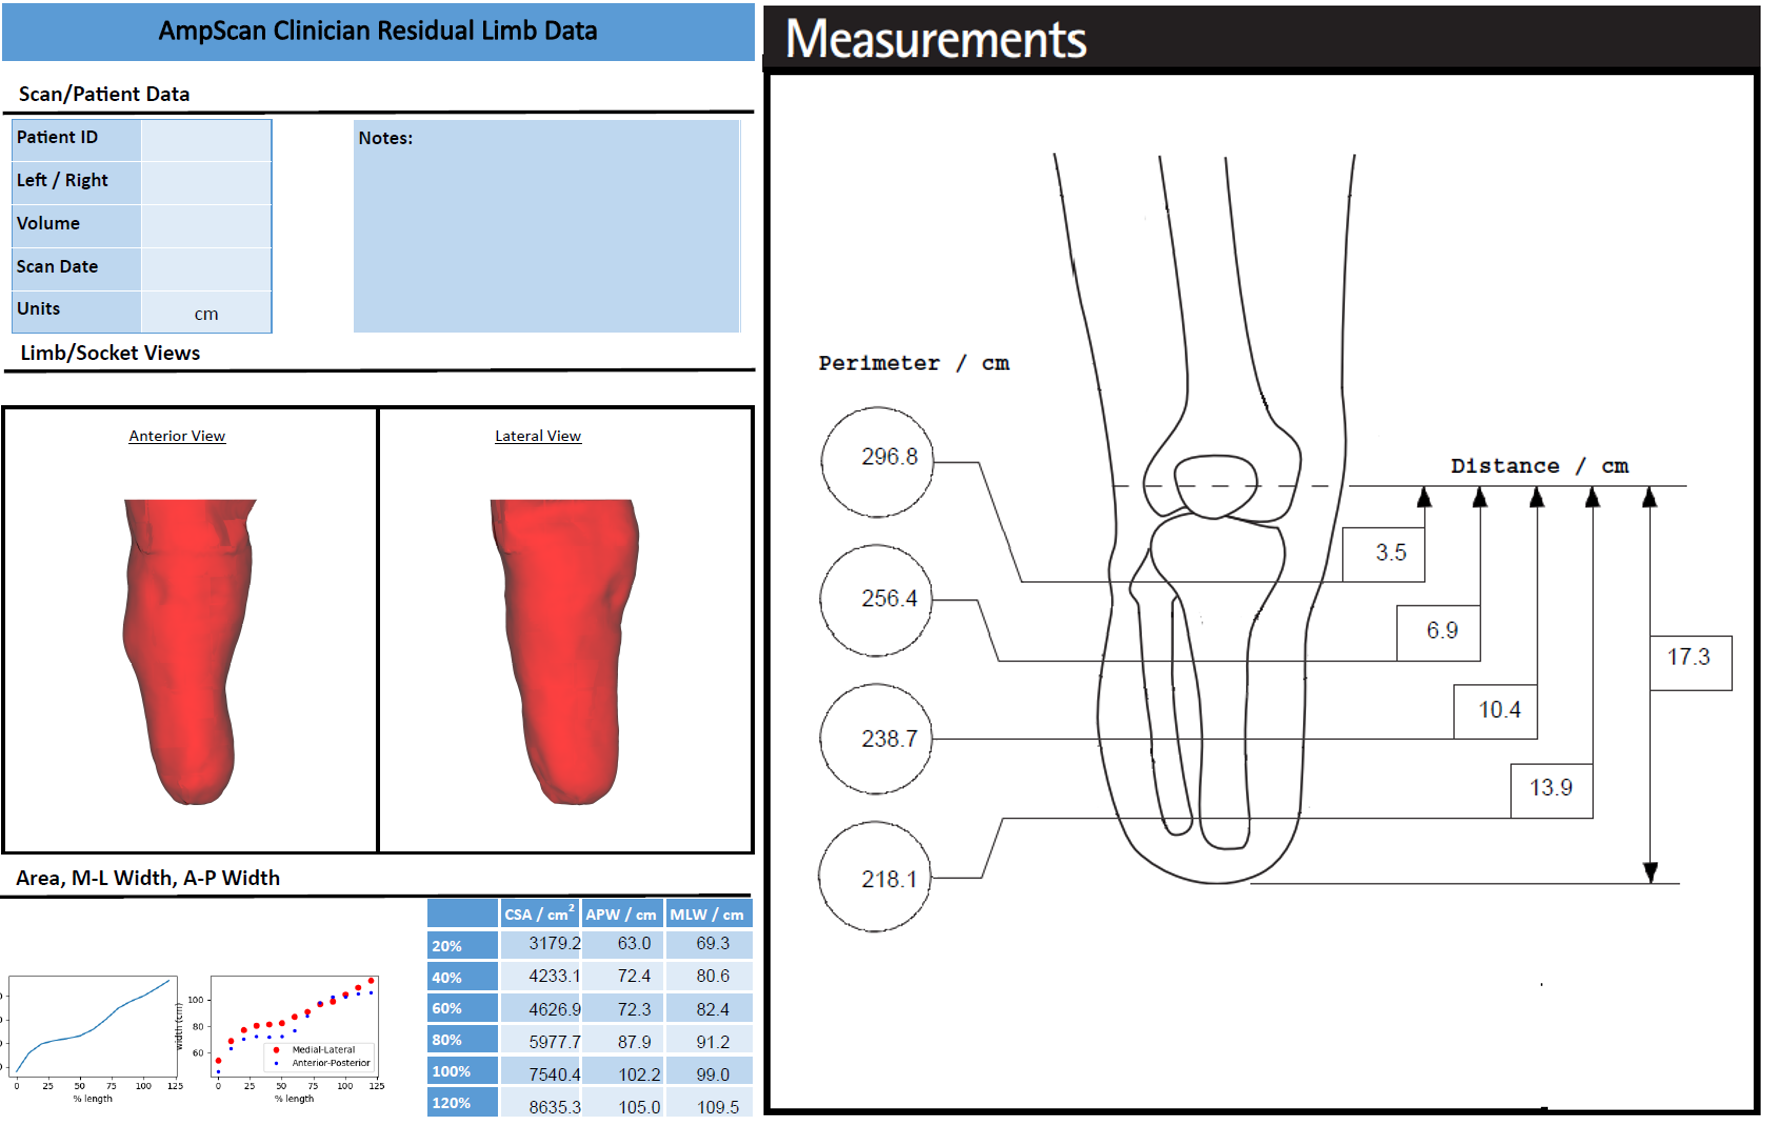
Measurements
Finally, to auto-generate an output report for each scan, first the Mid-Patella needs to be selected. The Mid-Patella is the point from which the cross-section area will be calculated. The selection tool can be found under the ‘Measure’ drop-down menu. Once the function has been selected, right-click to select the point.
Following this, the measurements output can be generated from Measure drop-down. The resultant output will be a pdf with an example given below